The Owner-Occupied CRE Quarterly
A focused read on 25-year SBA 7(a) commercial real estate lending: approvals, loan size, portfolio health, and where the deals are. Built from SBA loan-level FOIA data, isolated to the one segment that actually behaves like commercial real estate. Data as of March 31, 2026.
Q1 Gross Approvals
$2.45B
up 7% year over year
Q1 Loans Approved
1,445
down 13% year over year
Median Note Rate
8.2%
down 55 bp year over year
Median Loan Size
$1.25M
up 33% year over year
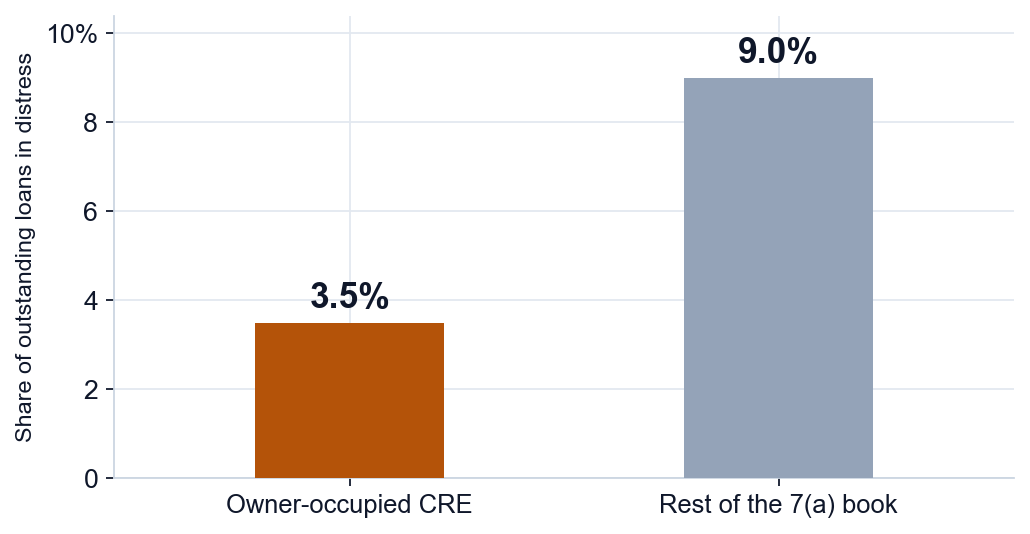
The safe corner of commercial lending. Owner-occupied CRE carries 3.5% in distress, less than half the 9.0% rate across the rest of the 7(a) book. Across more than 30 years of SBA lending, just 34 of these loans have ever charged off.
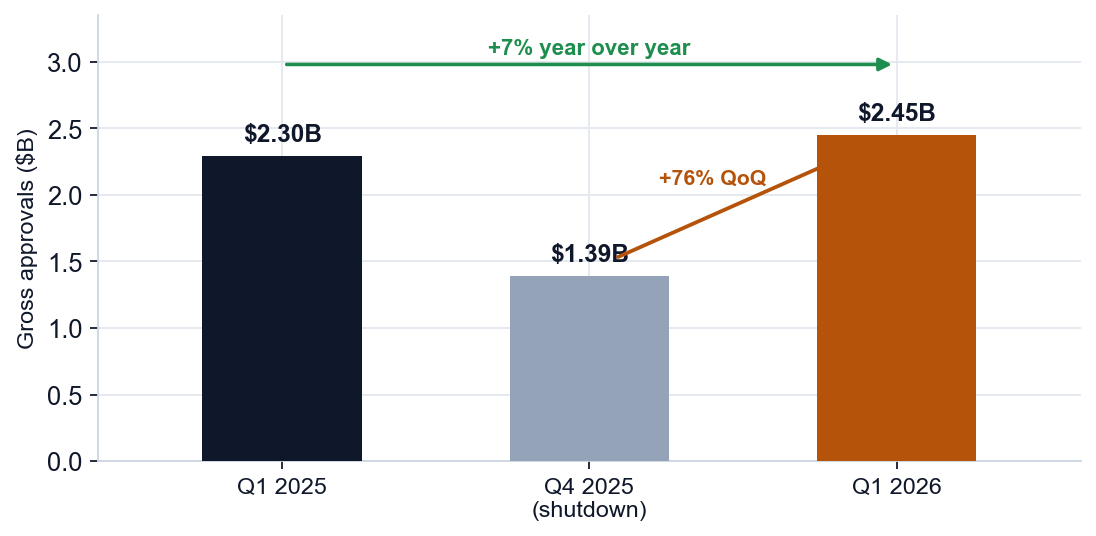
A record first quarter, with an asterisk. Gross approvals hit $2.45 billion, up 7% year over year, but the Oct-Nov federal shutdown pushed a backlog into January, so part of the record is catch-up rather than pure new demand.
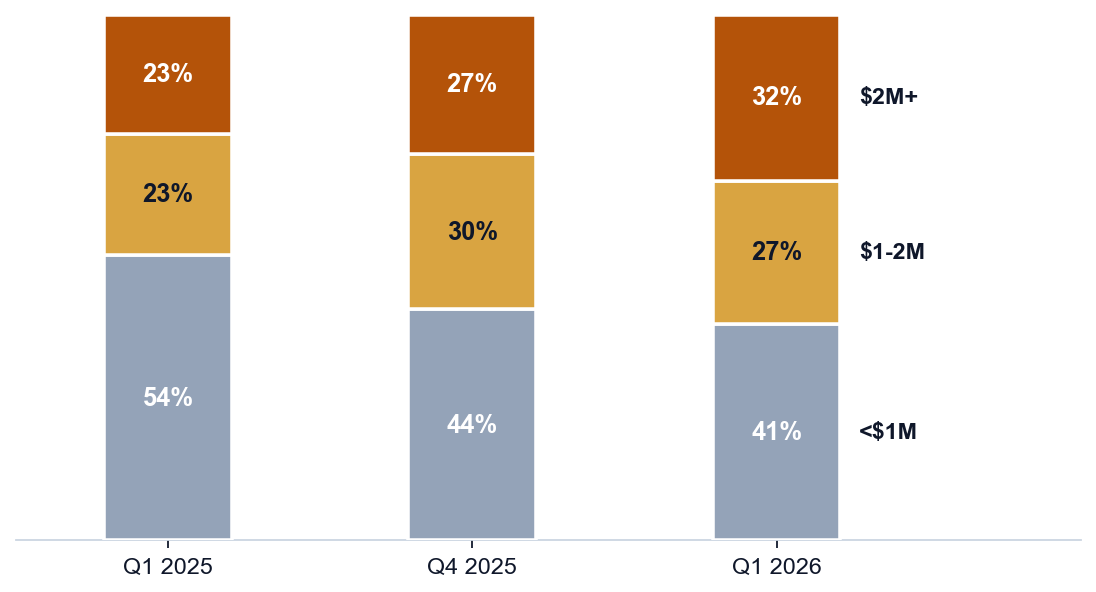
The market moved decisively up-market. Deals under $1 million fell from 54% of approvals to 41%, while deals of $2 million and up are now nearly a third, lifting the median deal to $1.25 million, up 33% year over year.
A fragmented field, with share still up for grabs. No single lender captured even 8% of the quarter's dollars. The market remains one of the most open corners of the SBA book.
A record first quarter, with an asterisk.
First-quarter 2026 was the strongest opening quarter on record by dollar volume: $2.45 billion across 1,445 loans, up nearly 7% year over year even as the loan count fell 13%. The catch is timing. The Oct-Nov shutdown closed October approvals and pushed a backlog into January 2026, which ran about 1.5 times a normal month, so part of the dollar record is post-shutdown catch-up rather than pure new demand. The year-over-year read is still clean, though: Q1 2025 was an uninterrupted full quarter, and this quarter cleared it by 7%.
The market moved up-market, and it moved fast.
The deal mix shifted decisively larger across all three quarters. Deals under $1 million fell from 54% of approvals to 41%, while deals of $2 million and up climbed from 23% to nearly a third of the market. The $1 to $2 million tier held around 27%. That up-market shift lifted the median deal to $1.25 million, a 33% increase year over year, and signals that the most active buyers in this segment are businesses taking on larger real estate commitments.
Owner-occupied CRE is the safe corner of the 7(a) book.
Of roughly 43,000 owner-occupied CRE loans outstanding today, 96.5% are performing and only 3.5% sit in some stage of distress, less than half the 9.0% distress rate across the rest of the 7(a) portfolio. The reason is collateral: when these loans go bad there is a building behind them, so they rarely end in a full write-off. Across more than 30 years of lending, just 34 owner-occupied CRE loans, a 0.02% lifetime loss rate, have ever charged off.
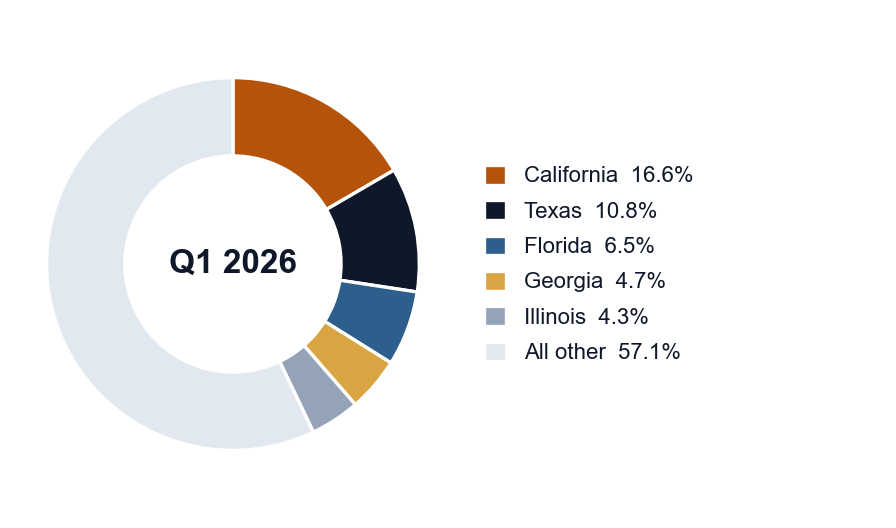
Hotels led the quarter; the map held steady.
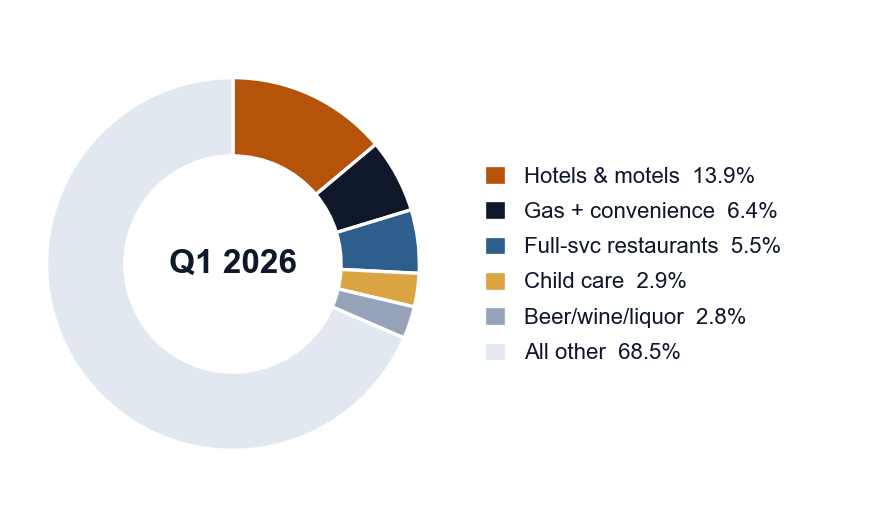
Hotels and motels surged to 13.9% of approvals by loan count, nearly doubling their 7.9% share from a year earlier, the sharpest industry shift in the quarter. Geography held its pattern: California and Texas together took more than a quarter of the market, and California has anchored between 15 and 20% of national volume in each of the last five first quarters, a durable concentration that reflects where owner-occupier demand runs deepest.
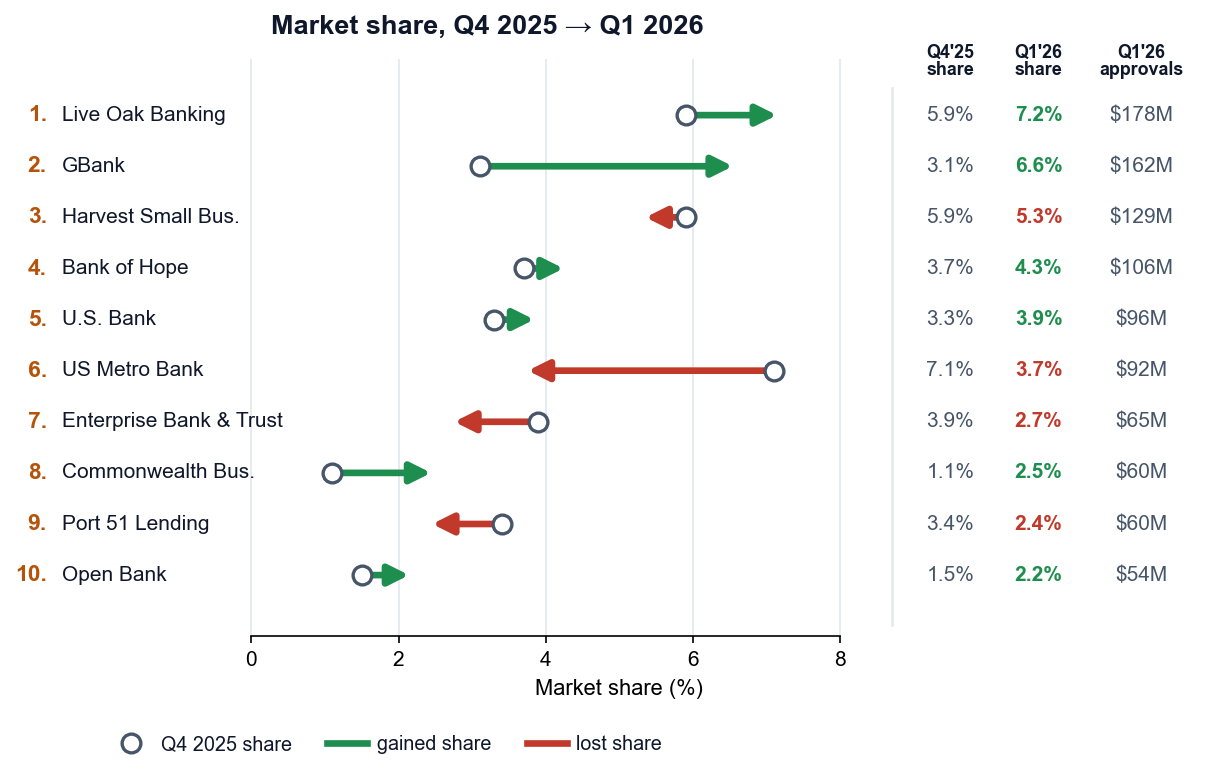
A fragmented field, with share still up for grabs.
The OO CRE market belongs to no single player. In Q1 2026, no lender captured even 8% of the quarter's gross approval dollars, making this one of the most fragmented segments in the SBA book and leaving meaningful share available to any institution that wants to compete. Ranked by Q1 2026 gross approval volume.
Methodology. SBA 7(a) loan-level data published under FOIA, as of 03/31/2026. Owner-occupied CRE is defined as loans with a 300-month (25-year) term, the maturity SBA permits only when owner-occupied real estate is the predominant use of proceeds. Calendar-year basis, not SBA fiscal year. Approvals by approval date. Volume, loan-size, and lender shares are on a gross-approval basis (including approved-but-not-yet-disbursed loans). Distress is current loan status as of 03/31/2026, a point-in-time snapshot, not a by-vintage comparison. The Oct-Nov 2025 federal shutdown closed E-Tran for roughly six weeks; quarter-over-quarter comparisons against Q4 2025 reflect that gap. Year-over-year comparisons are used throughout. For educational purposes only. Not investment, lending, tax, or legal advice.
Want this read on your deal?
I publish this analysis because the data is the job. If you have an owner-occupied building in mind, or a client who does, let’s talk it through.
Schedule a Call